Support and Resistance is a powerful tool in technical analysis often sounding complex to those who just start to see the breeze of Forex trading. But it’s not in reality? Experienced traders will narrate their feelings after years of trading with strategies based on marking support and resistance lines on charts. The principal aims of engaging in support and resistance trading by some capable professionals are to determine the direction of the market, monitor entry positions in the market, and more importantly establishing an exit point when encountered profit or loss.
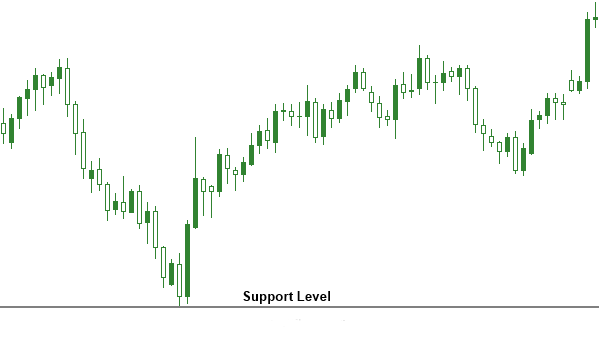
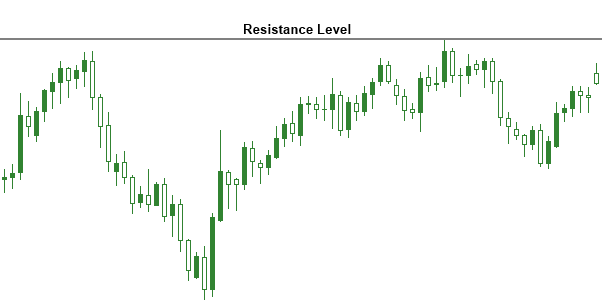
Support is the level or area on the chart under the market where buying interest is sufficiently strong to overcome selling pressure. Usually, a support level is identified beforehand by a previous reaction low. Resistance is the opposite of support and represents a price level over the market where selling pressure overcomes buying pressure. The resistance level is usually identified by a previous peak.
How to Identify Support and Resistance Levels
Support and resistance levels are identified beforehand. Identifying a support level implies finding a previous low. On the other hand, a resistance level is identified by a previous peak.
The more times the price bounces off a support the stronger this support is. Conversely, the more times the prices fall back from a resistance the stronger that resistance is.
In an uptrend, the resistance levels usually represent pauses of the trend which is exceeded at some point. In a downtrend, the support levels pause the trend temporarily but usually they are not sufficient to stop the trend permanently.
Understanding the Trend Concept
Now let’s introduce the trend trading with the use of support and resistance levels. For an uptrend to continue the support levels must be higher than the previous level (support level). As for the resistance level, the level should be higher than the one preceding it. In the case that a corrective dip occurs in an uptrend, that comes all the way down to the previous low, you must take it as an early warning that the uptrend is ending or that the uptrend turns to a sideways trend. Should the support level be violated, then it’s most likely you have a trend reversal from up to down.
In general, failure to exceed a previous peak in an uptrend or a failure to bounce off the previous support low in a downtrend is considered the first sign that the existing trend is changing.
Role Reversal
As we know, support is a previous low and resistance is a previous high. However, this is not always the case. Whenever a support or resistance level is penetrated by a significant amount, they reverse their roles and become the opposite. This means, a resistance level becomes a support level and support becomes a resistance level.
To prove this, we need to use an example. Let’s assume that the traders are divided in three categories. Those who went long, those who went short and those who did not decide yet what is their next move.
Let’s assume that the market moves higher from a specific support level. Those who bought on the support level are delighted but at the same time they regret that they did not buy more on the support level. So they consider that when the market dips back to the support level, they could buy more. Those who went short suspect that they are on the wrong side of the market. They are hoping for a dip close to the area that they sold so they can get out of the market in a break even point. The undecided realize that the market is going higher and they are willing to buy on the next good buying opportunity. So they are all determined to buy in the next dip in the market. Naturally, if the price declines near that support level, all three groups will go long and this will push the prices up. This means the more trading takes place in that support level, the more significant that support level becomes.
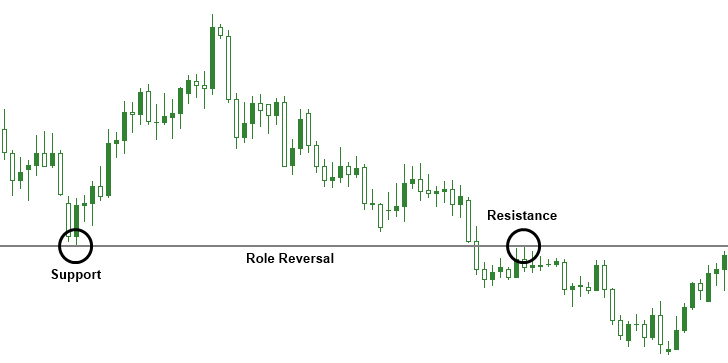
The image above shows a support that is violated. The support levels become resistance levels on subsequence bounces.
Now let’s assume that instead of the market going up the prices move lower. If the prices move more below the previous support level, the reaction becomes the opposite. All traders who bought, realize that they are probably mistaken. We need to ask ourselves what created the previous support level in the first place. Basically, it was that the traders’ majority went long. All of the factors that created the support level in the first place by the three groups will now function to put a sell order over the prices on subsequent rallies or bounces.
Finding Trade Breakouts
Remember that the more times the prices hit the support or resistance the stronger these levels are. So in order to have a breakout in a strong support or resistance zone, then you should expect an explosive price movement above the resistance level or below the support level.
Typically to determine a breakout you need to wait for a confirmation. So for example, let’s assume that you use the four hour time frame. The prices open beyond a support or resistance level but by the end of the four hour candlestick the price moves above the support level or below the resistance level. This is considered as a fake out as it does not confirm that the prices will continue in the new direction.
Round Numbers
There is a general tendency for round numbers to stop advances or declines. Traders tend to think in terms of important round numbers such as 10, 20, 50, 100. These round numbers will often act as psychological support or resistance levels. Traders can use this information to begin taking profits as an important round number is approached.
An excellent example of round numbers is the gold market. In 1982 the market low was right at $300.In the first quarter of 1983 the market went up to above $500 and then fell to $400.You had another rally in 1987 that stopped again at $500 and from 1990 to 1997 gold failed to break through $400.
Another trading application on the round numbers is to avoid placing new trades right at these obvious round numbers. If a trader wishes to buy into a short term market dip in an uptrend, it would make sense to place a limit order just above an important round number. This is because other traders more likely wish to buy at the round number and as a result the market may never get there. As a general rule, protective stops on long positions should be placed below round numbers and on short positions above such numbers.
Conclusion
It is very useful once in a while to pause and reflect on why the price patterns like support and resistance actually do work. It is obvious that is not because of some lines drawn on the charts. The patterns work because they provide pictures of what the market participants are doing and enable us to determine their reactions to market events.
Technical Indicators
Lessons in this section:
- Support and Resistance Lines
- Trendlines
- Channel Line
- Bollinger Bands
- The Relative Strength Index (RSI)
- Moving Averages