The technique of Bollinger Bands was developed by John Bollinger. The Bollinger Bands are two bands that are placed around a moving average. In addition, Bollinger Bands are placed at two standard deviations above and below the moving average, which the moving average is usually set at 20 periods. Now you should know that Standard Deviation is a statistical concept that describes how prices react around an average value. With the use of two standard deviations this ensures that 95% of the price data will fall between the two trading bands. The general rule here is that the market prices are considered to be overbought when the prices touch the upper band and this produces a sell signal. On the other hand, the prices are considered to be oversold when they touch the lower band that produces a buy signal.
Using Bollinger Bands
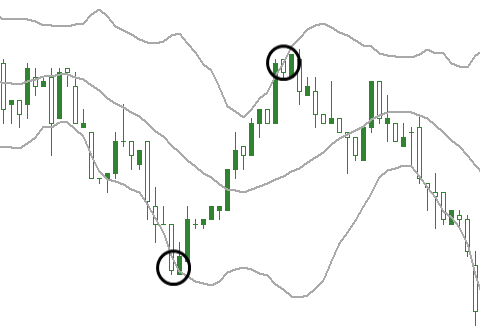
The easiest way to use Bollinger Bands is by using the upper and lower bands as the price targets. When the prices bounce off the lower band and cross above the 20 period average, the price target is the higher band. Similarly, when you have a crossing below the 20 period average you can identify the lower band as the price target. Usually, in strong uptrends, the prices fluctuate between the upper bands and the 20 period average. In such cases, when you have a crossing below your 20 period average this is a warning of a trend reversal to the downside.
In the event that the price breaks the lower band, this signals the start of a new move. A downward break is considered as a bearish signal and an upside break is a bullish signal.
Despite that using Bollinger Bands is relatively easy, you should at least combine your strategy with a basic chart analysis to confirm your signals.
Band Width Measures Volatility
During a period of rising volatility, the distance between the two bands widens. On the other hand, when there is a period of low volatility the distance between the two bands narrows. There is a tendency for the bands to change between expansion and contraction. This means that when the bands are unusually far apart this is often a sign that the current trend may be ending. When the distance of the two bands has narrowed, this is often a sign that the market may be about to initiate a trend. Bollinger bands work best when they are combined with overbought/oversold oscillators.